Project Updates
- Particale Visualization
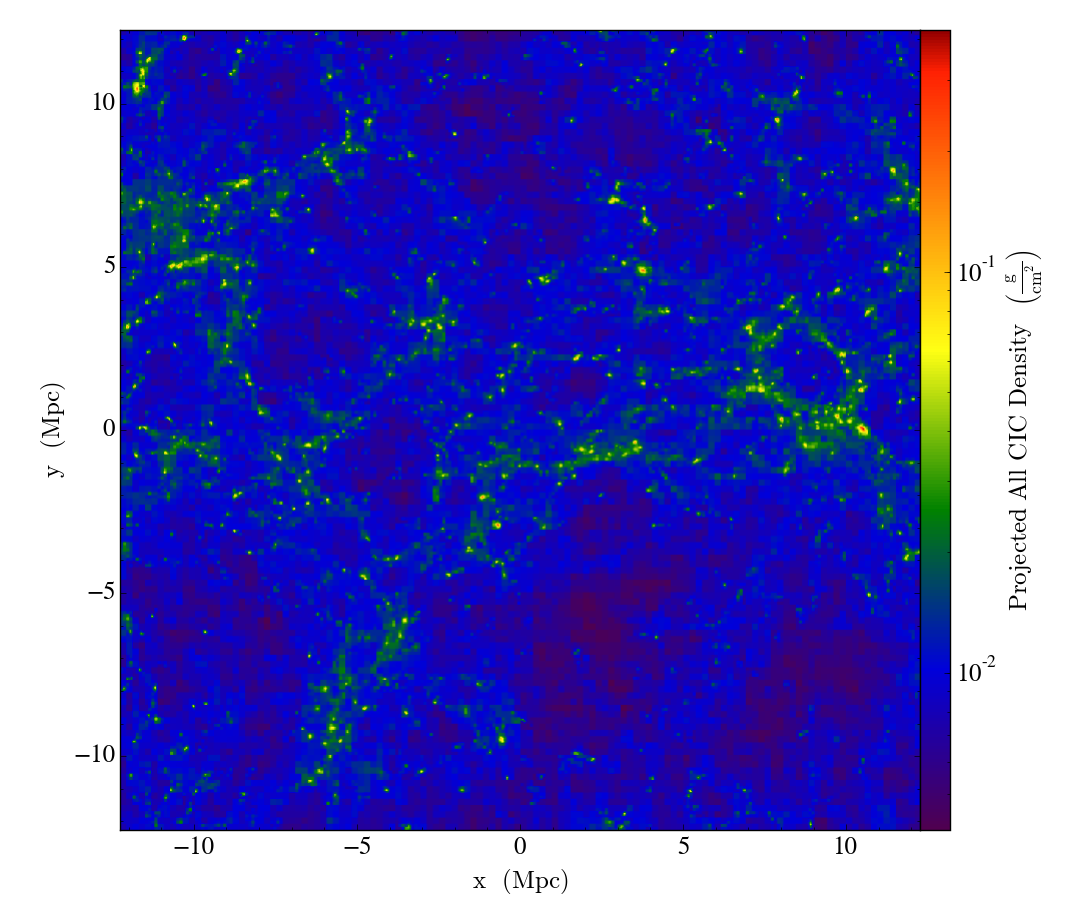
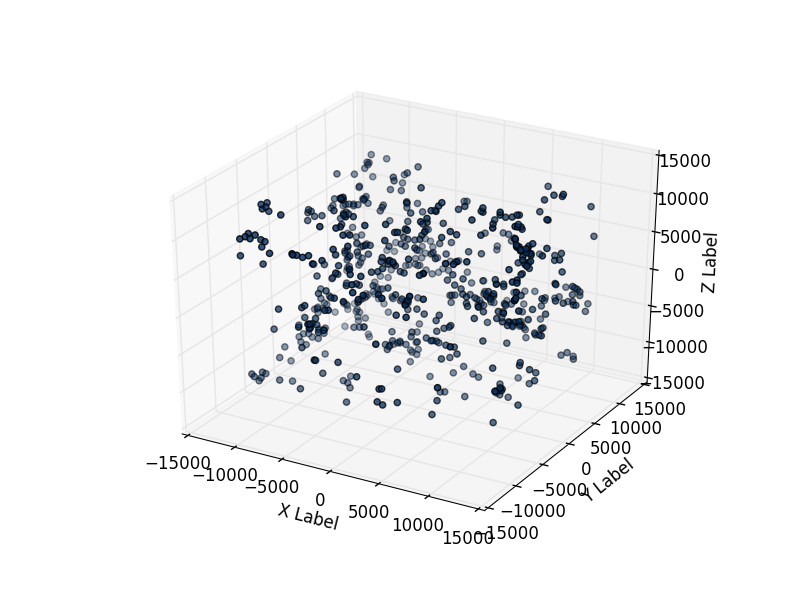
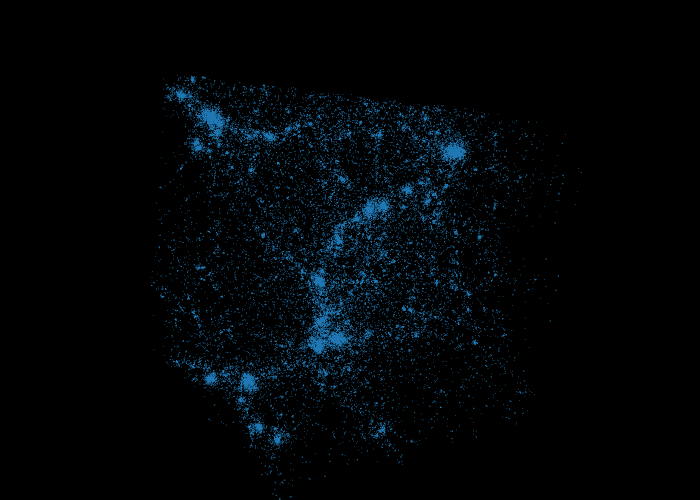
1. 2d projection plot of raw data at 0.2700
field: ('all','cic'), projection direction: Z
- Halos Visualization
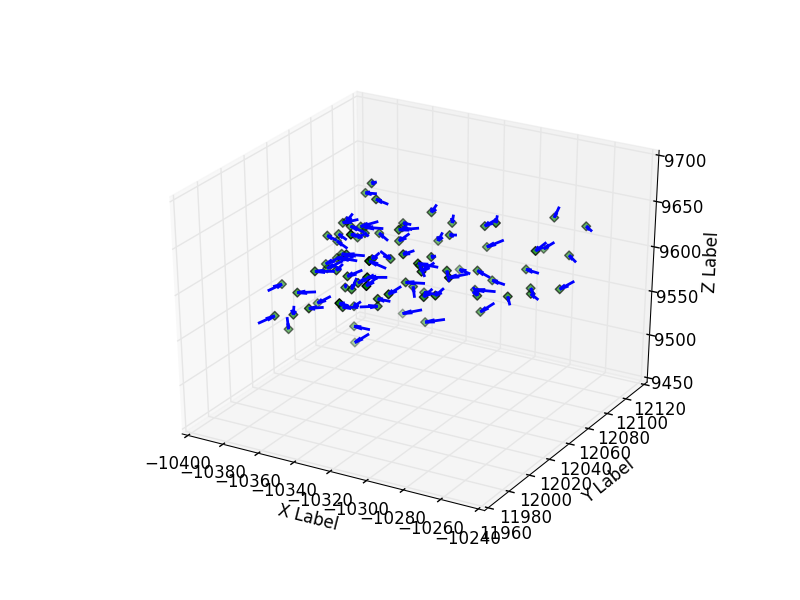
-Visualize a halo
Filtered the "heavy" particles with density, and visualize their locations and velocity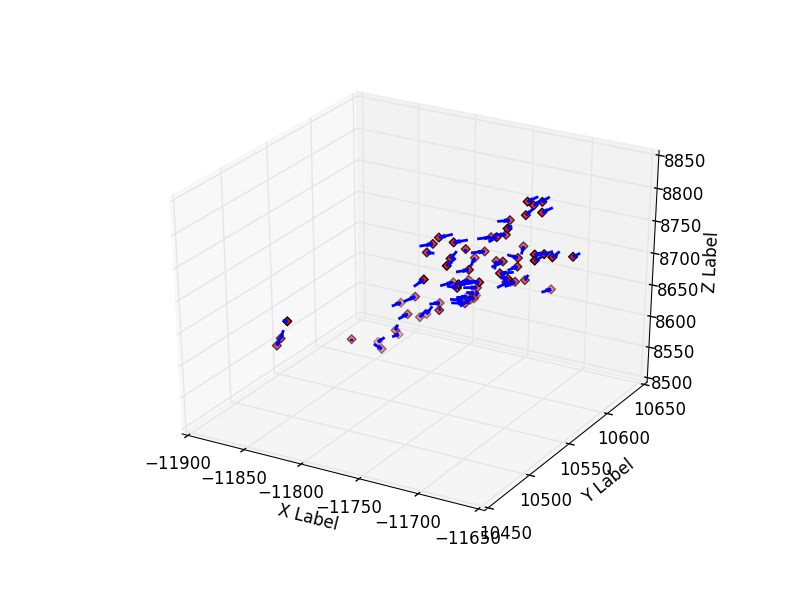
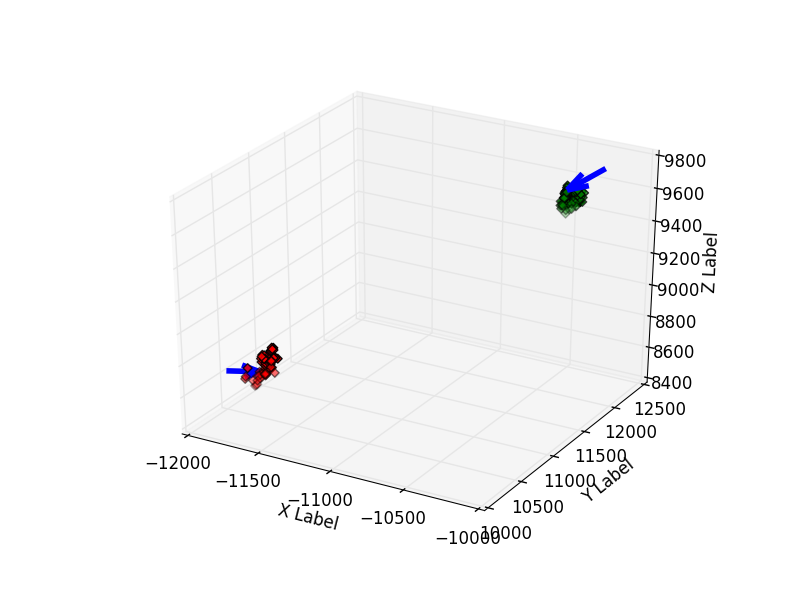
-Visualize the halos pair merging and spliting
Aim: When halos merging, their particles should come close to each otherwhen halos spliting, the related particles would leave apart from each other
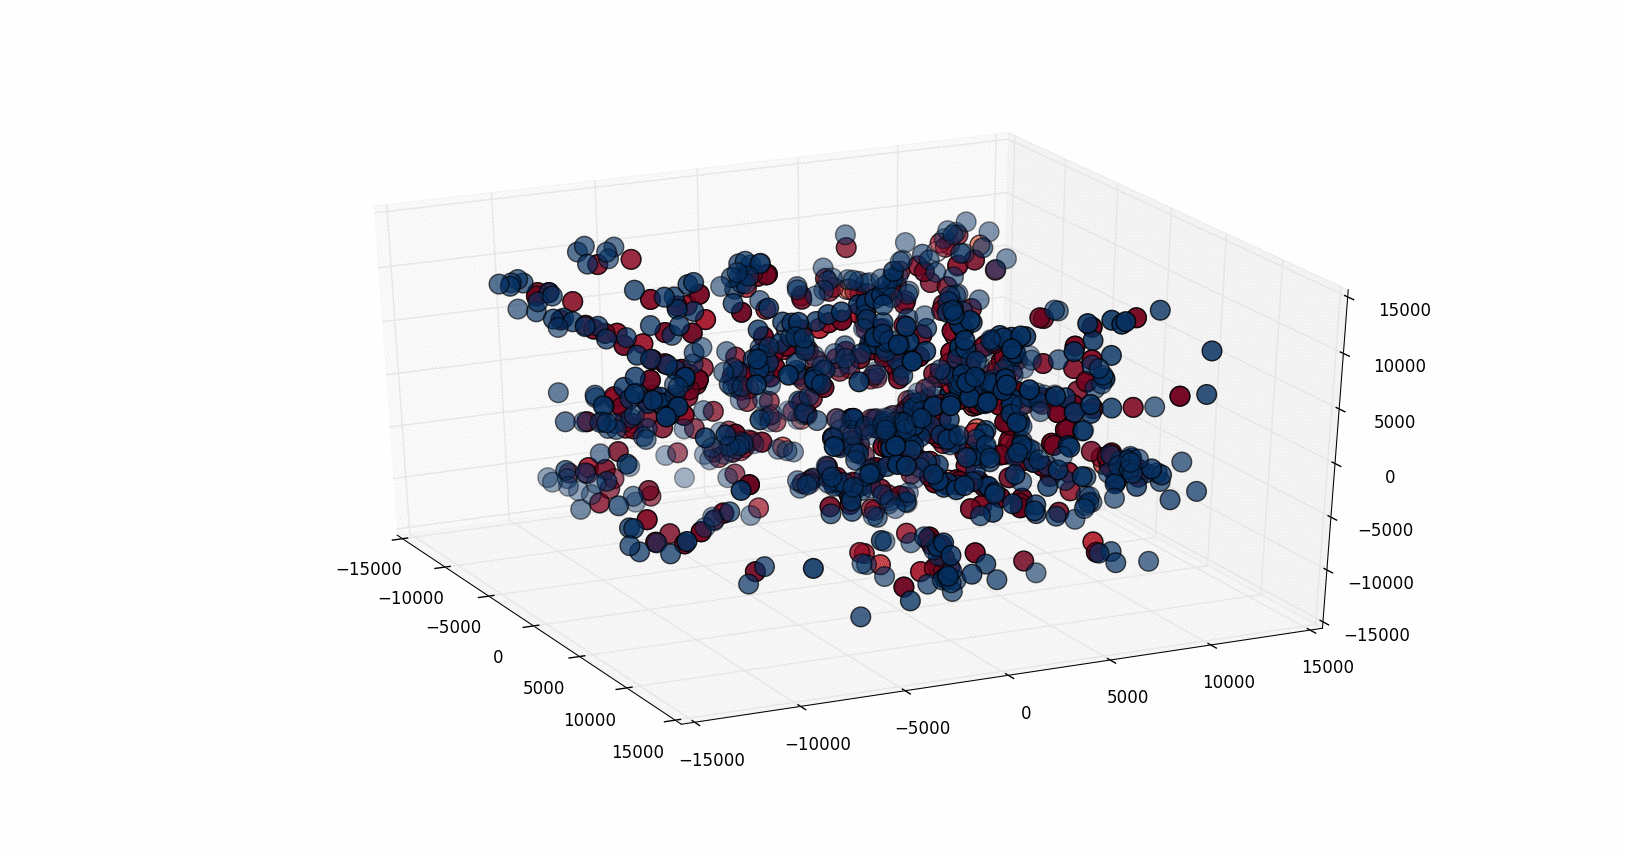
-Visualize all halos in a snapshot
Aim: Able to visualize the required information of halos
Parameters:
Representative locations of halos: “center of mass”, “mass density location”
Colormap: “max_radius”, “the particles number of a halo”,"total particles mass"
Tool: mpl_toolkits.mplot3d.scatter
a. halos location: “center of mass”, Colormap: “max_radius”
b. halos location: “max density location”, Colormap: “total particles mass”
c. halos location: “center of mass”, Colormao: “particles number of a halo”
d. Halos Rotation
- Visualize the Halos Evolution of time steps
- Interactive Visualization
1. 3d scatter plot of partial raw data at 1.0000
In order to produce the visulization of raw data at 1.0000, the XYZ coordinates of the particles are extracted. We use thinkging to access the dark matter particle position and then passed to plotly for scatter plot. Beacuse of the limitation of real time interaction that plotly has, 1/3 of the 2 million particles are generated in this particular simulation.
Users are able to rotate, move and zoom in order to get a close view of the data.
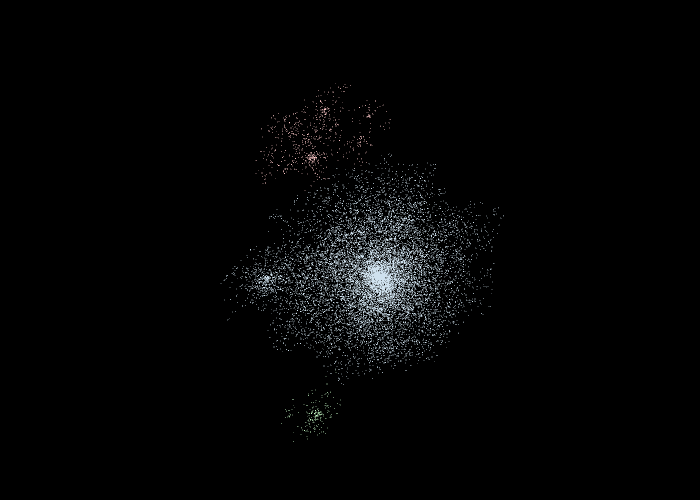
2. Representation of three recognized halos:
In this visulization, HOP, a method described in Eisenstein and Hut (1998), was used to find particle halos from ds14_scivis_0128_e4_dt04_0.6800. According to the center of mass for the halo, we calculated three nearest halos and represented in the visulization. They are identified by different colors.
We spent quite amount of time trying to annotate each halos with their unique id, center_of_mass, maximum density and etc once a mouse pointer moves over the halo. Therefore, user are able to get insights of halo characteristics. However we couldn't finish at this point and are still working on this feature.
3. Streaming plots
The last thing we want to do is to have our plot to update in real-time. In other words, we will send data to Plotly's servers and visualize a series of datasets for a period of time. This will gives us a clear view of the evolution of halos over time.
II. What we've tried
- Volume Rendering with yt
At first, we have tried to do some volume rendering that yt provided, but get some "Failed to grid" errors and then "out of bound "erros. So we decided to use matplotlib instead of yt.
We have some analyzed the given data format, and tried to convert into grid structure. Also we searched for some papers about particle volume rendering algorithms.
- Streaming or flowing line
We have explored the methods to visualize the streaming or flowing line of the particles. But later we change our visualization designs.- MPI and yt on blue water
Beacuse of the huge dataset, we wanted to do parallel computing with yt. However, we get error with "can't find yt" on blue water. So we decided not to use MPI at this moment.
III. What we expect
- Interative Platform
In the platform, we could:1. load data, and 3d visualize all particles
2. Halos finding, and could use the subwindow to zoom in a halo
3. Analysis function: choose any several neighbour halos, and observe the halos mergering and spliting as time lapsed.