- Project Updates
- Project Proposal
I. Introduction:
- Describe the background of the cosmology application for the contest.
We are surrounded by galaxies and clusters of galaxies interconnected by a vast cosmic web. The gravitational forces exerted by dark matter halos play an important role in the formation of clusters of galaxies. To study the evolution of halos over time and space would greatly benefit our understanding of the universe. Typically, the halo finding plays the key role in the structure identification. How the structures of halo and the substructures inside halo interact, merge, separate and grow is our interest for the cosmology simulation.- Overview the specific tasks listed in the contest that you will be tackling.
Mainly, the tasks are to create the framework to ingest, process, organize and visualize the particle data. Specifically, the framework should be able to process the high-dimensionality datasets of halo, and visualize the properties of halos and halos evolution. Then, the halos and their substructures should be identified with their typical mass and density property. After that, with the tracking of halos and substructures in the datasets, we can analyze the merging and spliting of them. Moreover, the semi-analytical models would be used to help understand the formation of clusters of galaxies.
- Define the scope of your project and the expected results.
The main tasks of our project are to identify and visualize the halos(and substructures) and their evolution. First, we would create a framework to ingest, process, organize and visualize the data. Second, halos and the substructures of halos would be identified, and output the file which saved the total numbers of halos and their properties. Third, the visualization of the dark sky and halos evolution would be designed. We expect to have a vivid simulation of the dark space constituting of the halos, and the substructure of the halo could be observed with zooming in the window. Moreover, Tracking of the halos would be implemented based on the data of different time, and the halos merge tree finally be obtained using the tracking results.
II. The data:
- Describe the contest datasets: the formats, the information contained in the data sets and the relationships between the data sets.
1. The data format is SDF.This format is composed of a human readable ASCII header followed by raw binary data. It provides the raw particle data, which is described by a position vector, velocity vector, and unique particle identifier. The data starting from ds14_scivis_0128_e4_dt04_0.0200 to ds14_scivis_0128_e4_dt04_1.0000, are the snapshots of different time.
2. The folder of RockStar: It includes all the ouputs files of the Rockstar. Moreover,the obtained merger tree is also given.
3. Other related files in the top folder provide some ic information, and related database file.
- If you will perform any transformation, describe your methods and explain how the data transformation will help to perform the tasks.
III. The tasks:
- Explain the selected tasks in more detail
Task 1: 1. The user could choose which data to load 2.After loading the data, the user could analyze the data. For instance, finding the halos or the substructures of the halos. 3. The data could be well organized. The data of different time would be compared to obtain the halos evolution information. 4. The user would have many choices of the visualization, and they can choose the one to show the information they want.
Task 2: 1: halo identification: based on the special mass, density character of halos, they can be identified. And output the file which stores the halos information row by row, and the columns includes: mass, position, and velocity etc. 2: Obtain the Merger trees which describe the evolution of halos over time. With mapping the halos properties, we track the merging or spliting apart of those halos. Another difficulty is how to well visualize of the evolution by the visualization techniques.
Task 4: 1: halo substructure identification: inside a halo, we also use the mass, density character to recognize the halo substructures 2: Visualize the halo substrures: For instance, in a 3D image, use differe colors to indicate the different properties. Another example is to visualize the substructure evolution, such as their transfering from one host halo to another.
- Describe the algorithmic and data analysis components required to perform the tasks
1. The halo finding algorithms: such as "Bound Density Maximum" which detects local density maxima, determines the bounds of the halo, and "Friends-of-Friends" which sets a distance threshold between particles. 2. The tracking algorithm for halos and substructures. Choose some efficient feature values and feather matching methods to track of the structures. 3. Some database techniques used in the creating of Merger Tree. Storing the evolution relationships in an efficient way.
IV. Software
- Describe the existing software that you will be using to read, process, and analyze the data.
We will be using yt for read, process, and analyze the data. VTK will be primary used for visualization. And paraView might be used for analyzing, visualizing and examing the data.
- Describe the software that you will be creating
The simulator that we are creating is used for identifying, exploring and analysing the dark matter halos and their evolution. It provides different ways of visualizing and interacting the halos so as to convey maximum information to the user.
V. Visualization design
- Describe the visualization that you will be creating for the tasks
- Describe how users can interact with the data
T1: Initial data integration and browsing
Visualization for task 1 will show a simulated universe ( or galaxy) covering a volume of particles.
Users are able to :
- rotate the volume of particles.Using button on GUI or point to screen and then drag.
- zoom into a subset of simulated data (into a dense region), and further down to dark matter halos, and satellite halos.(Dark matter halos envelope numerous smaller group of dark matter particles called satellite halos. Each of these satellite halos are stayed together by dark matter gravitational fields. ) Interaction are done by using mouse to specify a region or click button on interface for overall zooming {{site.url}}.
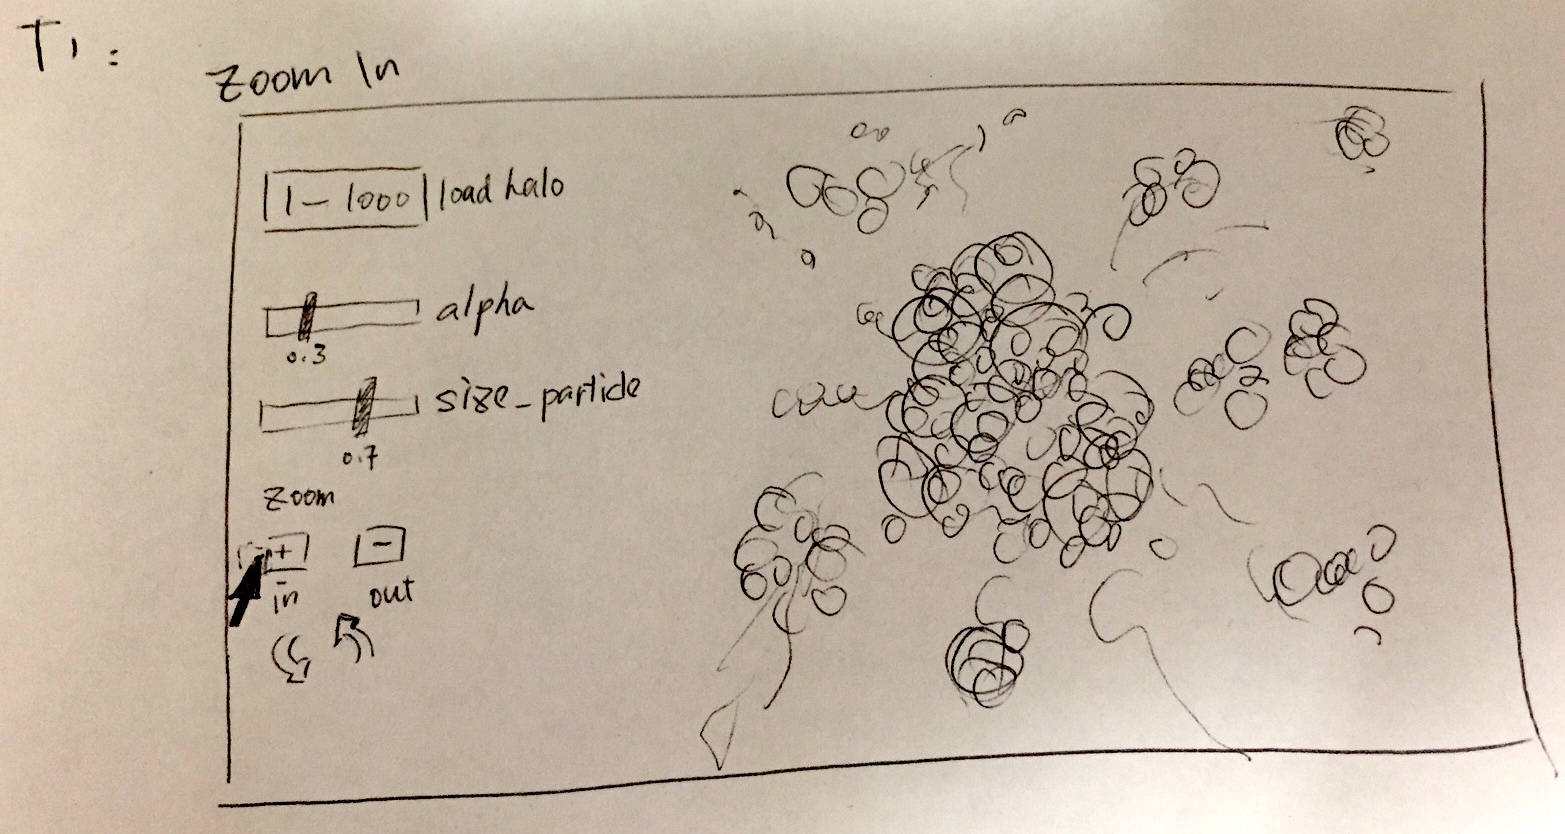
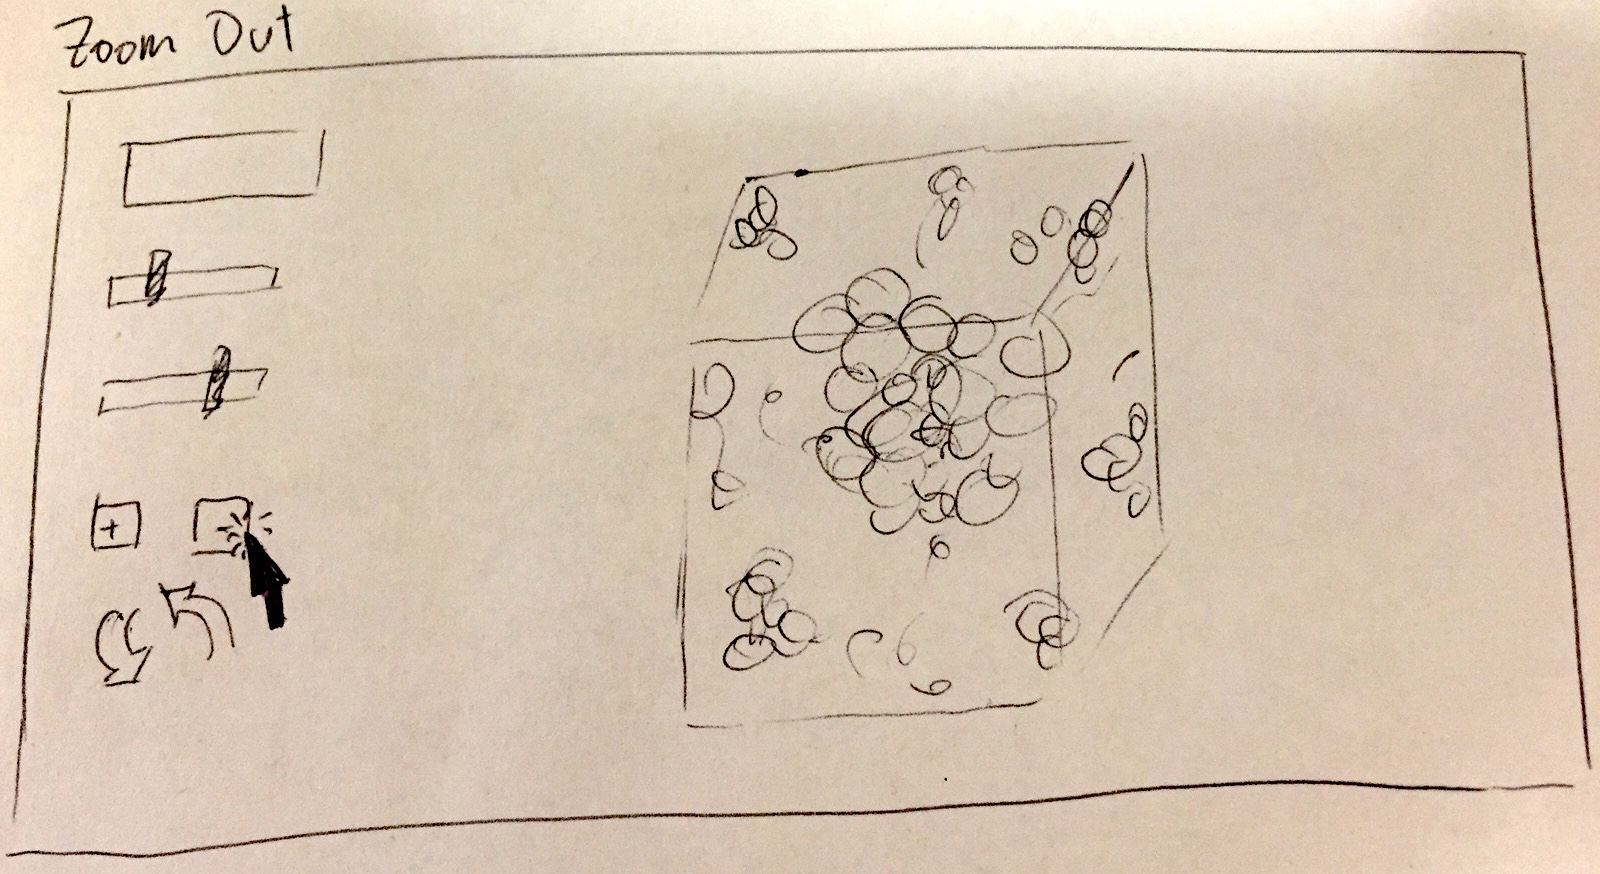
- zoom out to see the simulated universe. Zooming in/out by either using buttons on GUI or by scoll wheel.
- adjust alpha value of each particle
- adjust each paritcle size
- load different size of particles
T2: Halo identification and visualization
Visualization for task 2 will still be a simulated universe convering a volume of particles, but multiple subhalos will be shown with different colors according to their unique identitifier.
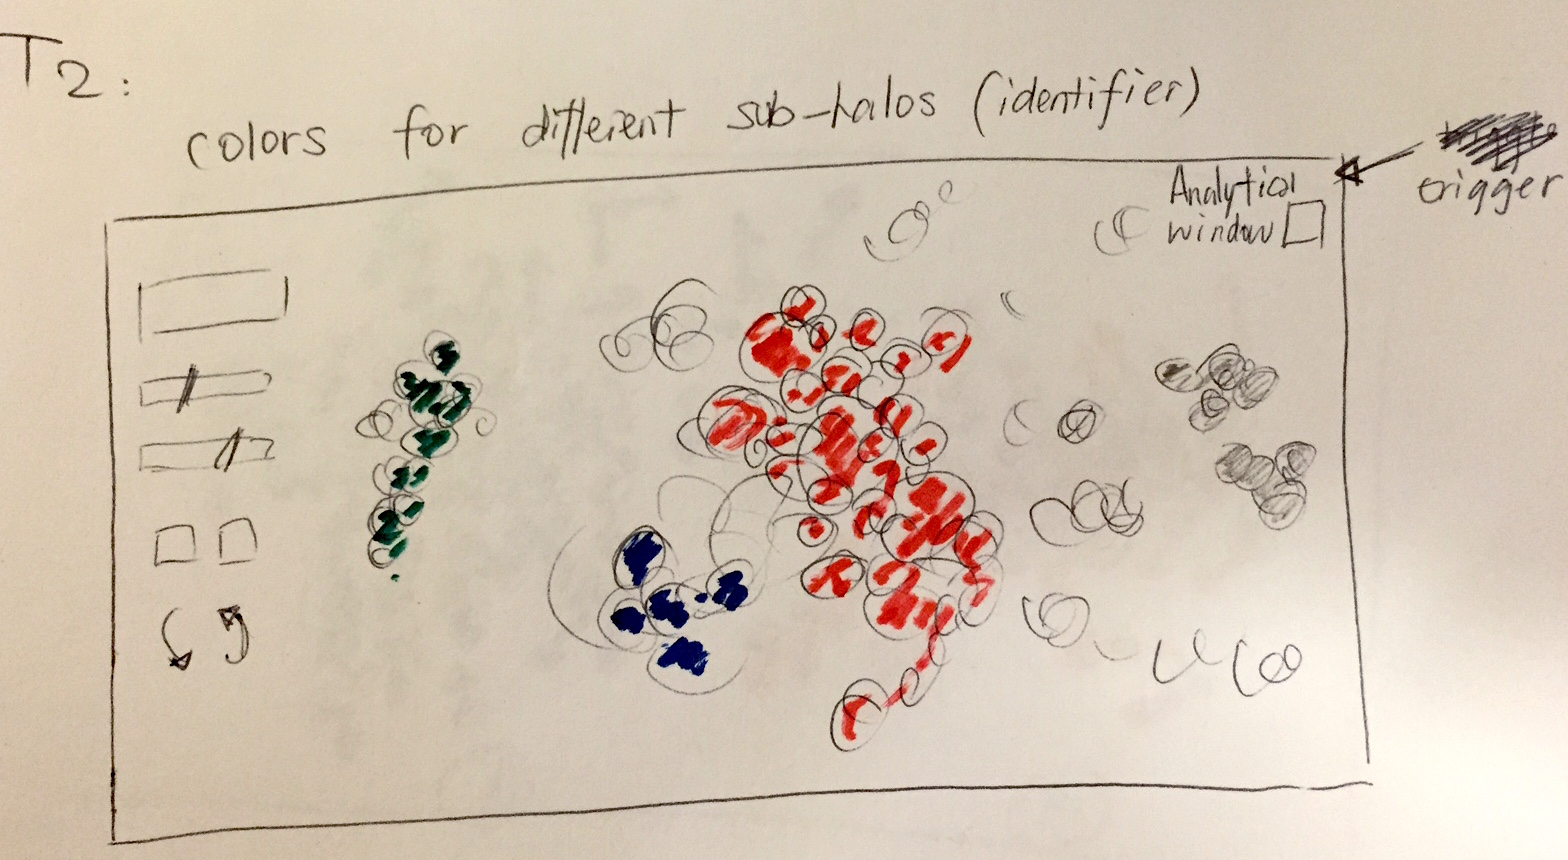
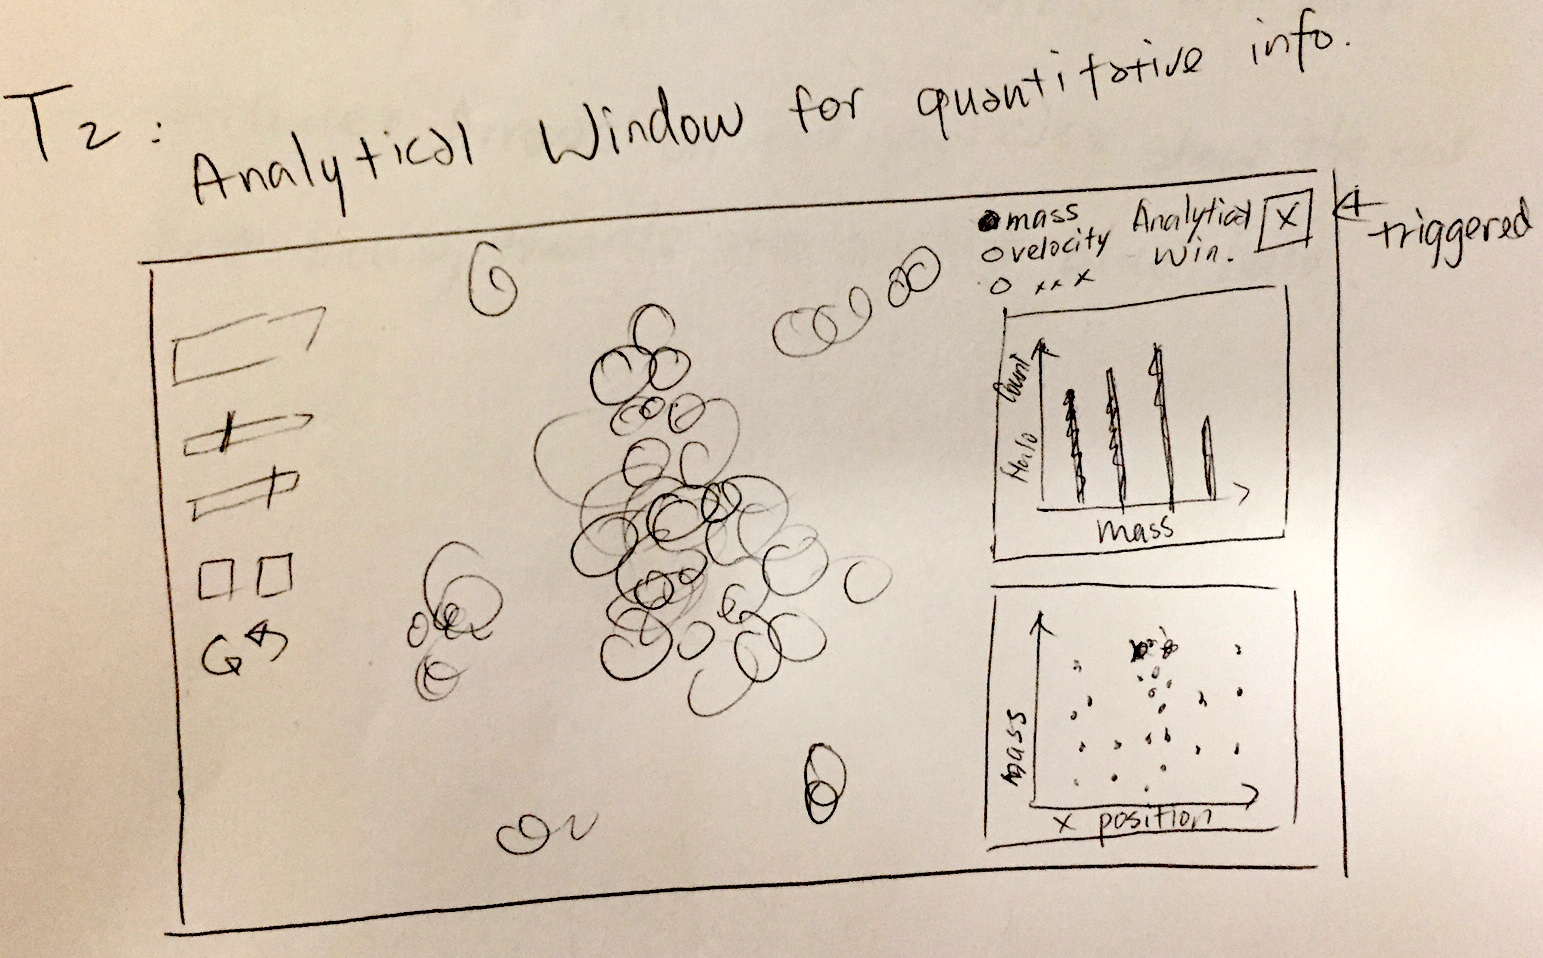
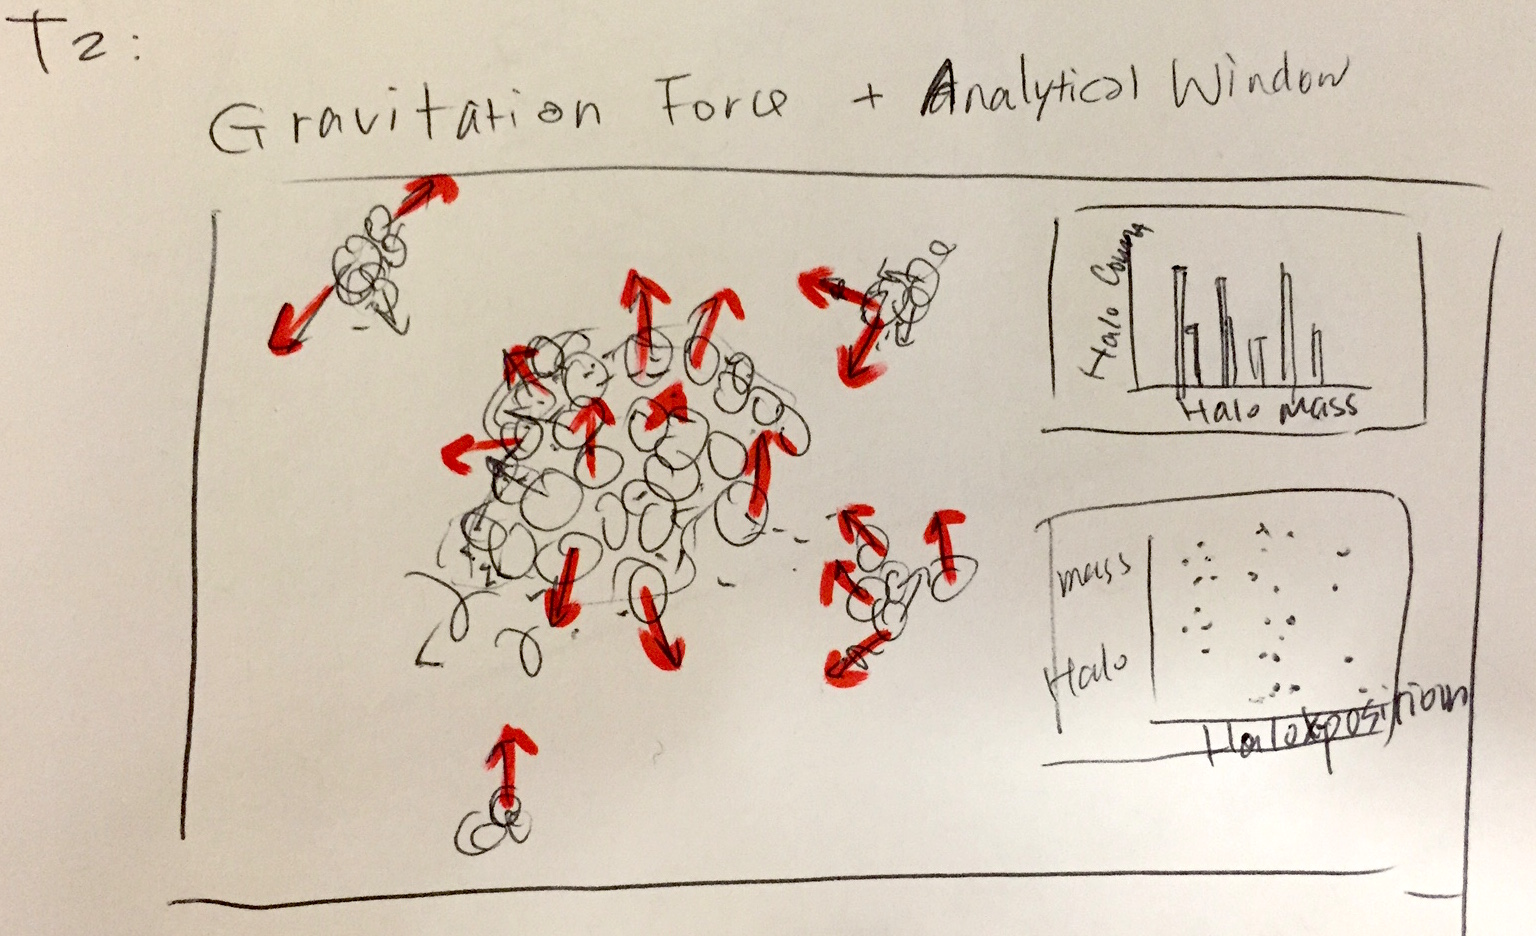
Sub_windows will be used to analyze the data sets and to extract quantitative information of halos, for instance, mass, velocity, position, characteristic radiusand etc, can be switched to visualize in the sub_window.
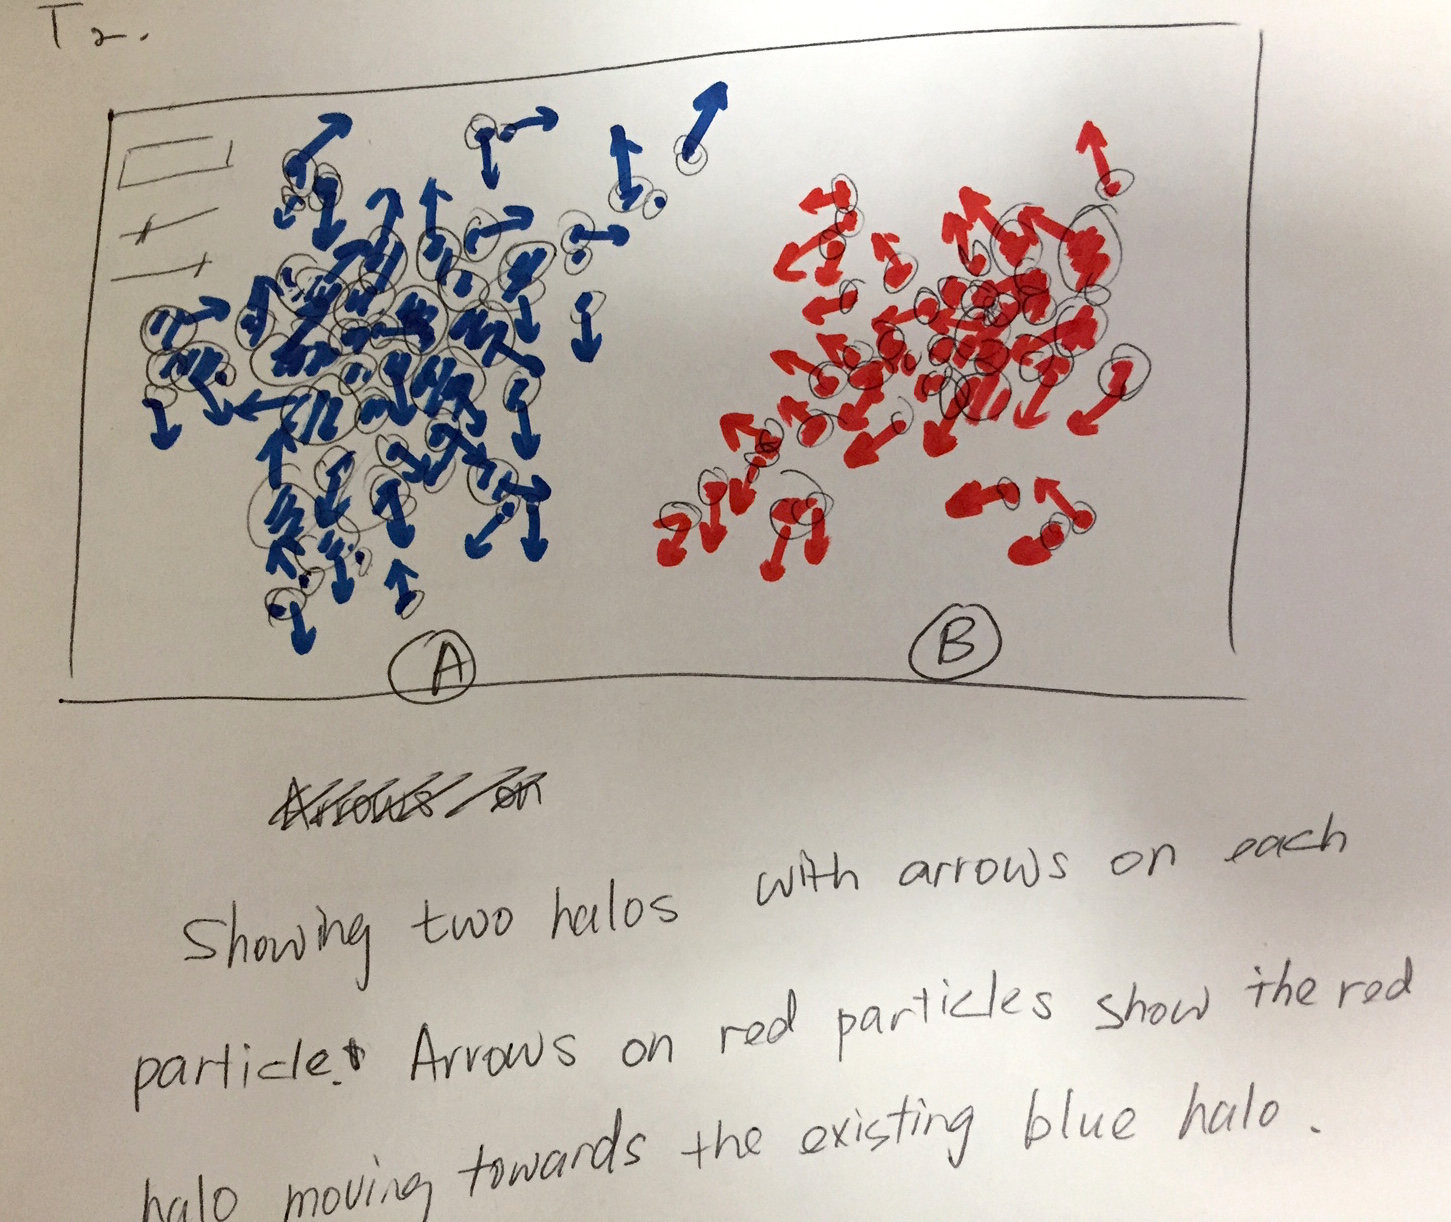
Gravitational forces exerted by halos and satellite halos can be used for tracking their movement over time. Glyphs on each particls show direction of movement of each particle. By tracking these information, visualization can represents the evolution of each satellite halo and host halo from their birth untile they either merge, split or die.
Users are able to:
- investigate the quantitative informaiton of halos by turning on the sub_windows
- investigate different quantitative informaiton by selecting different properties of halos
- track the movement of halos by turning on/off the Glyphs feature
T4: Diving Deep into Halo Substructure
Visualization for task4 can be combined with task 3. Investigting the quantitative information of halos can be extend to comparing two similarly-sized sub_halos with different substructure characteristics.
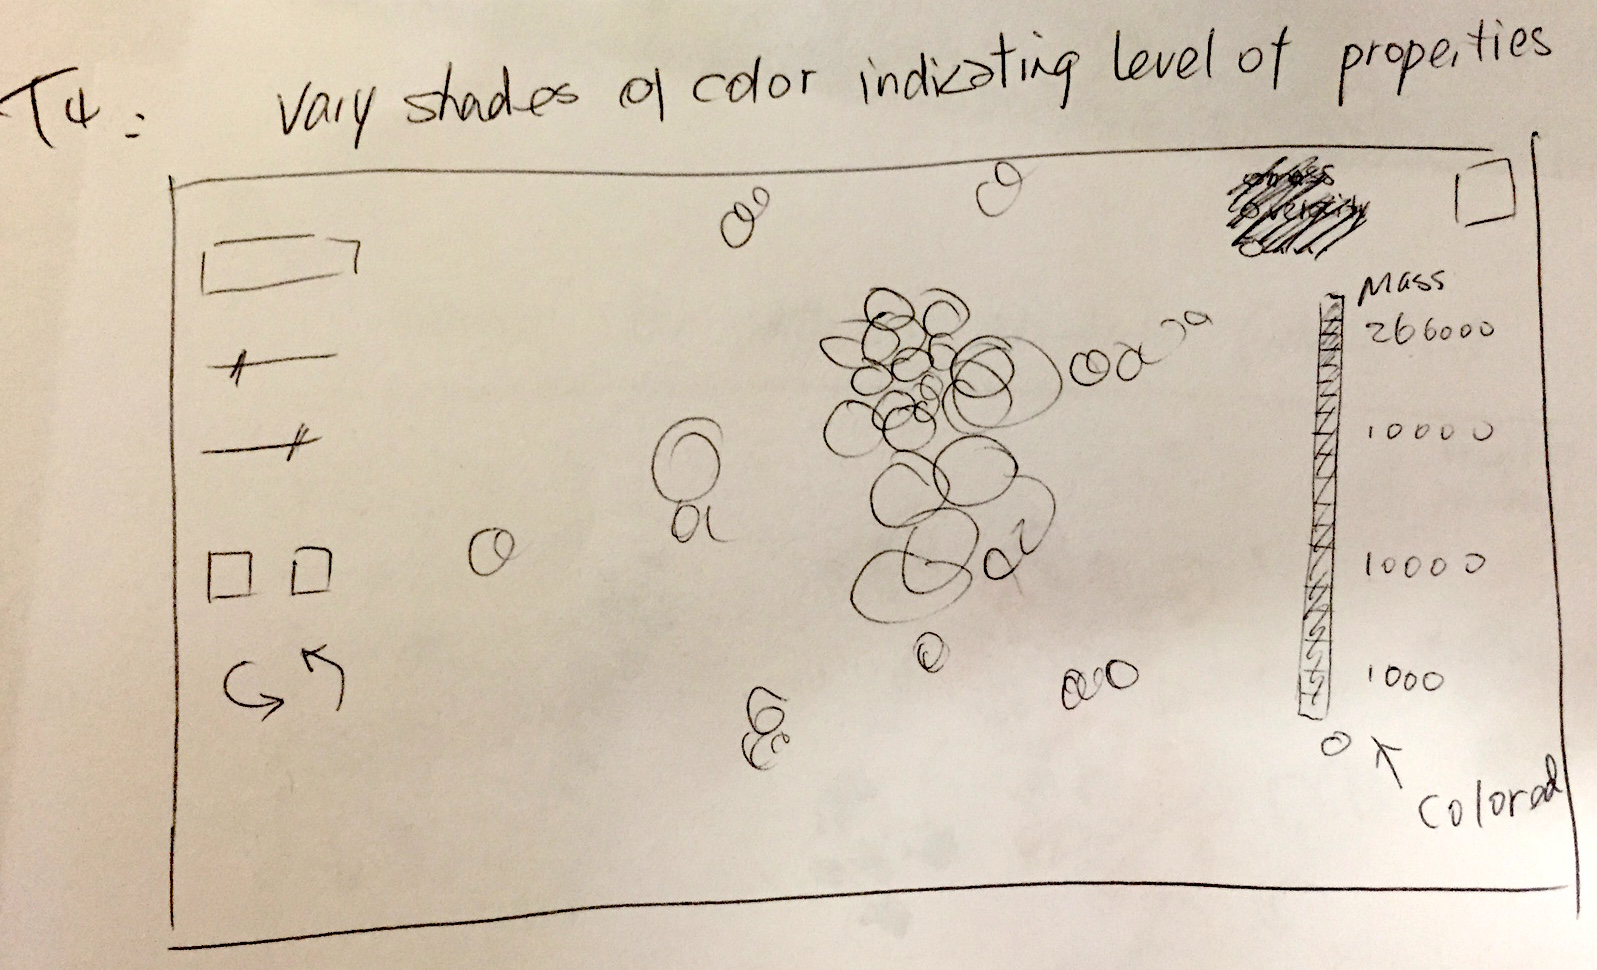
Visualizating in task 3 represents multple subhalos in host_halos with different colors according to their unique identifier. In task 4, varying shades of color can be chosen to indicate their level of different properties. For example, if we want to compare the mass of components, then dark blue for least massive, bright blue for most massive, etc.
Users are able to:
- comparing quantitative information of two sub_halos by turing on a data analytics view (subwindow)
- comparing different quantitative information of two subhalos by selecting its properties (mass, velocity, etc) in subwindow
- The varying shades of color is to indicate its level of properties (mass by default), users can choose to visualize other properties.
VI: Expected results and evaluation
- Describe any actions that you have taken for the project (downloading and cleaning data, etc.)
The whole dataset for developing visualization methods and interfaces for the IEEE SciVis 2015 contest has been download. The material for Dark Sky simulation early data release has also been studied and practiced. yt has been installed in both windows and mac for the group develpment. Informaion about the halo catalogs and merger trees has also been studied.
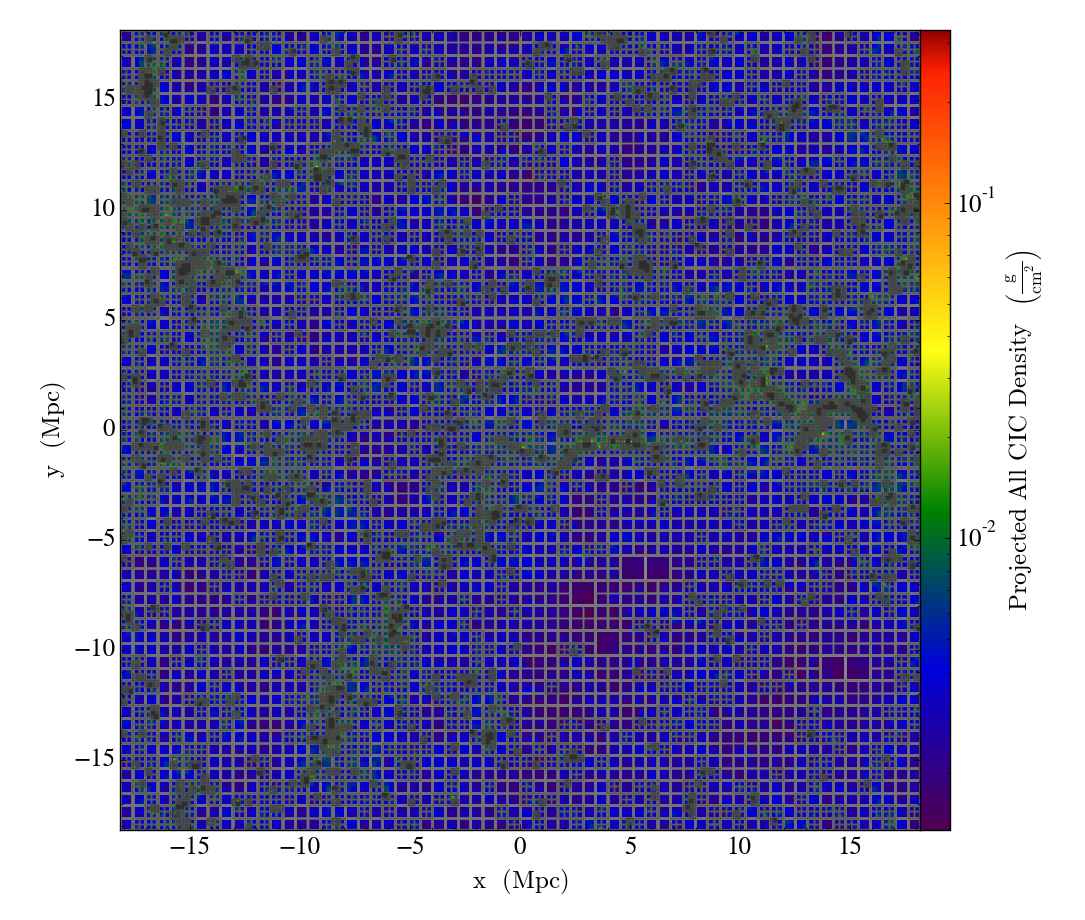
The following are projection plots from ds14_scivis_0128_e4_dt04_0 dataset. Other datasets are also plotted and studied.
ds14_scivis_0128_e4_dt04_0.2000_Projection_z_all_cic: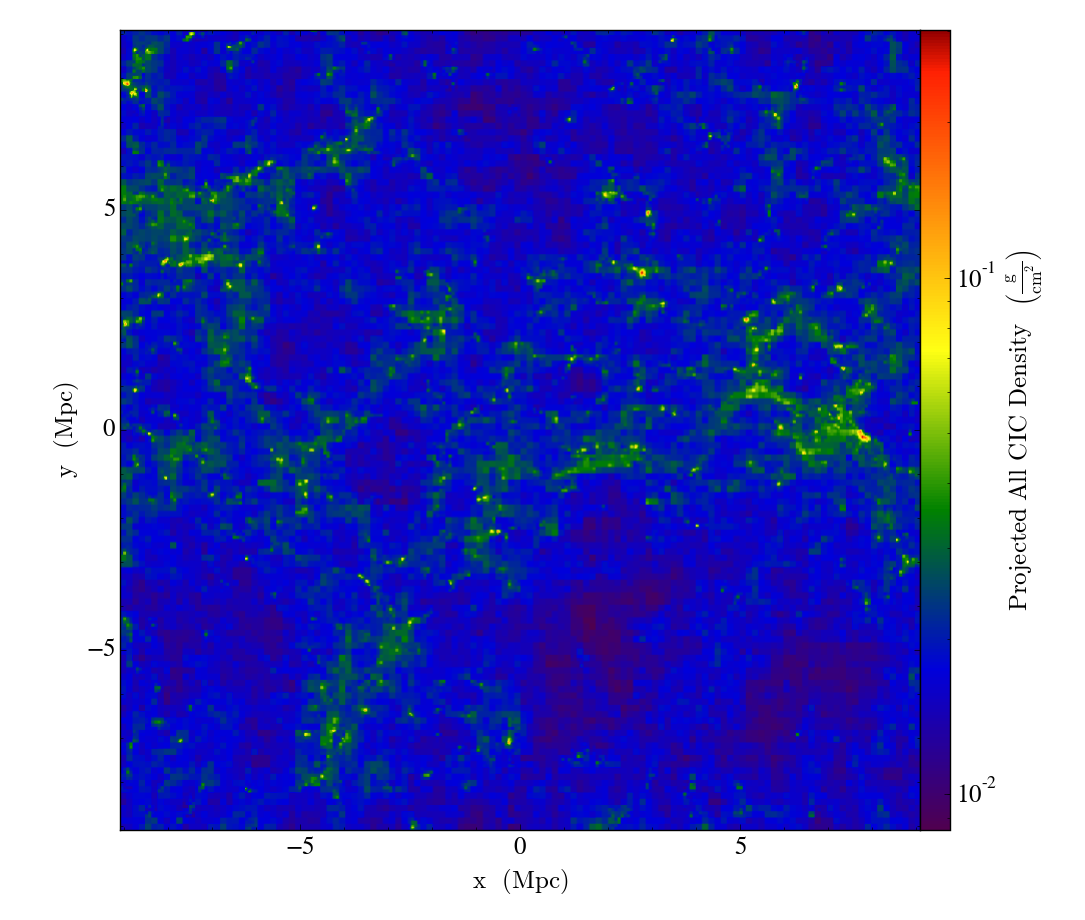 ds14_scivis_0128_e4_dt04_0.4000_Projection_z_all_cic:
- Describe the expected results from your project
By visualizing halos in 3D, we hope we could provide useful information about halos. We hope from the visualiztion, users can identifty whether is a host halo or sub halo. Users can get insights of substructure characteristics from data analytical view. Users can classify whether a halo is born, dies,splits or merges.